Last year was the second-costliest year for disasters since 1970, according to a new analysis from reinsurance firm Swiss Re AG. Global economic losses from these events reached $337 billion in 2017, behind only 2011’s total losses, and less than 40 percent were insured. A close look at Swiss Re’s data reveals several worrying trends. Losses from natural and man-made disasters are increasing, markets are not getting better at insuring them, and our own choices aren’t helping.
First, the natural disaster losses. As I’ve written before, it’s hard not to notice the hurricane and flood years (Katrina in 2005; the Japan earthquake and tsunami and Thailand floods in 2011; Harvey, Irma and Maria in 2017).

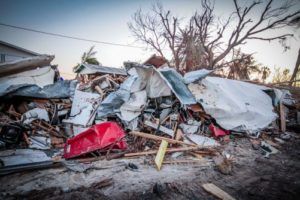
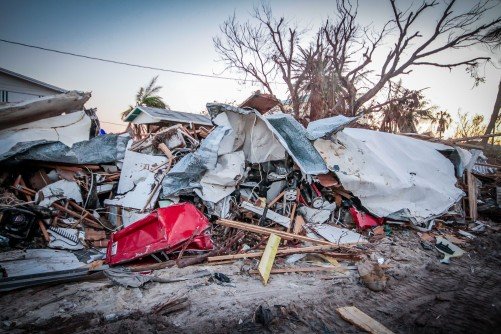
Thanks to three enormous hurricanes and massive wildfires hitting the U.S., 73 percent of the losses in 2017 were in North America. Almost half of North America’s losses were insured; Latin America and Asia each tallied 9 percent of global losses, with only 16 percent of those losses covered. The Oceania and Australia region fared best in terms of insured losses, second to losses at sea and in space, which were fully insured.
Fortunately, last year was far less costly for man-made disasters, which were a fraction of the record high hit in 2001 due to Sept. 11.
On a 10-year rolling basis, nearly three-quarters of all man-made disaster losses are insured, compared with just 30 percent of natural disasters. The rate of natural disaster loss insurance hasn’t improved significantly since 2007, and Swiss Re has a reason it might not improve: climate change.
According to Swiss Re’s report, natural catastrophe risks “will continue to evolve as changing variables like a warming climate, growing populations, and urbanization drive (and likely expand) the loss-potential of natural world hazards.”
That risk isn’t just from hurricanes, which draw energy from warmer waters, or flooding due to warmer air carrying more moisture. Swiss Re’s report includes some fairly harrowing statistics on wildfires:
Large wildfire losses in the western US and Canada in recent years have raised questions about observed trends in frequency and intensity. One significant trend is longer wildfire seasons, defined as the time between the first discovery and the last control of a wildfire. On average, wildfire seasons in 2003-2012 were around 84 days longer than in 1973-1982. The extension corresponds with longer burning times of large fires: between 1973 and 1982, on average large fires burned for six days before being contained; in 2003-2012, the average large fire burn time was more than 50 days.
My Bloomberg View colleague Christopher Flavelle took a close look last month at how wildfires affected California in 2017. Decades of building at the so-called wildland-urban interface have put more homes at higher risk from wildfires, yet people return to build despite warmer, drier conditions creating ever-greater threats. The scale of that wildland-urban interface continues to increase, now comprising 297,000 square miles, 44 million housing units and nearly 99 million people.
In 2010, that wildland-urban interface equaled the size of Texas and South Carolina put together; it contained a third of U.S. housing units and a third of its population.
People choose to live there; insurers are increasingly choosing not to insure dwellings at the edge of city and wilderness. Perhaps the best question to ask, then, is this: As these damages increase – and become increasingly uninsurable – are these economic losses natural, or are they man-made?
This column does not necessarily reflect the opinion of the editorial board or Bloomberg LP and its owners.
Was this article valuable?
Here are more articles you may enjoy.


 Berkshire Utility Presses Wildfire Appeal With Billions at Stake
  Hackers Hit Sensitive Targets in 37 Nations in Spying Plot
  One out of 10 Cars Sold in Europe Is Now Made by a Chinese Brand
  Portugal Rolls Out $2.9 Billion Aid as Deadly Flooding Spreads