Although Berkshire Hathaway’s Warren Buffett and Ajit Jain told investors last month that GEICO is playing catch-up with Progressive to improve technology and connect rate to risk, Berkshire’s personal auto insurer still surpasses Progressive on customer satisfaction.
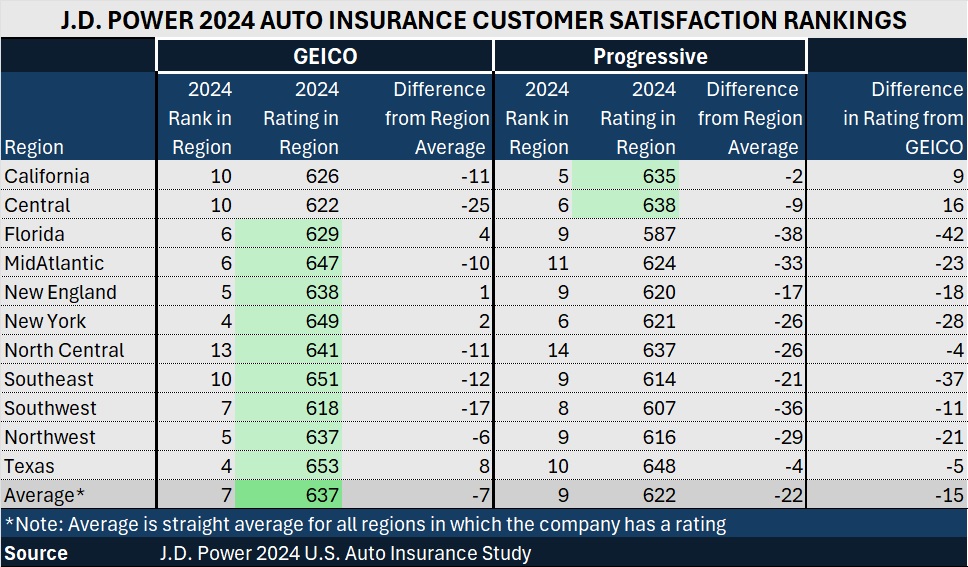
According to the J.D. Power 2024 U.S. Auto Insurance Study, GEICO’s customer satisfaction scores top Progressive’s in nine of 11 regions for which J.D. Power publishes the customer-based ratings.
Related article: Berkshire’s ‘Most Important’ Biz Drives Q1 Results; GEICO Still Behind on Tech
In four regions, GEICO was among the top 5 insurers ranked by customer satisfaction scores. Progressive had a top-5 ranking in only one region, California.
The J.D. Power study provides satisfaction ratings for individual carriers in 11 geographic regions of the country—with anywhere from nine to 17 carriers listed for each region. Satisfaction is measured on a 1,000-point scale, ranging from a minimum score of 529 for Kemper in California to a maximum of 713 for Erie in the Mid-Atlantic. Across all regions, the average score landed at around 646 in the 2024 study.
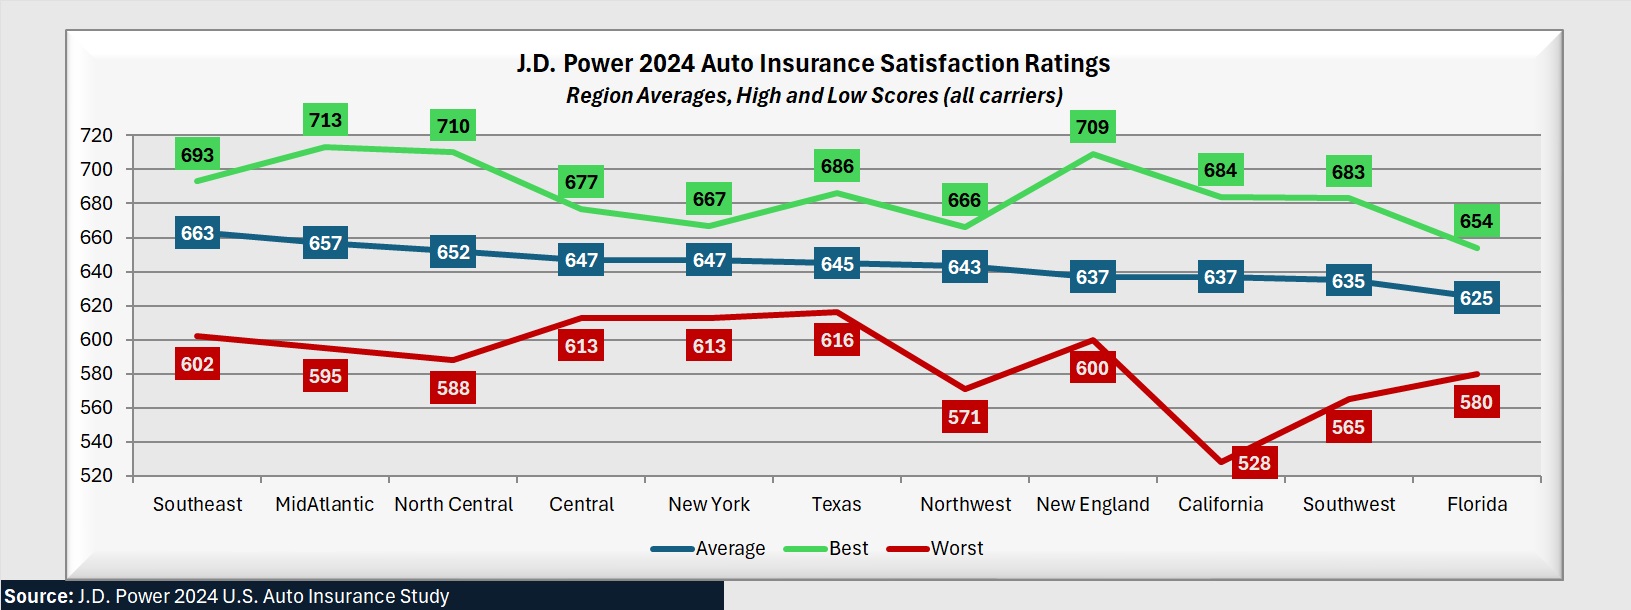
Erie Insurance, NJM and Amica Mutual recorded customer satisfaction scores above 700 in the Mid-Atlantic, North Central and New England regions, where scores spanned ranges of more than 100 points. Regional average scores varied from a low of 625 in Florida to a high of 663 in the rest of the Southeast, with a median score of 645.Across all regions, GEICO’s average score is roughly 637, which is 15 points higher than Progressive’s average score of 622. (The 637 and 622 ratings were calculated by Carrier Management as the simple straight average of the 11 regional scores.) In 2023, the relative average scores of the two carriers were closer—only 5 points apart—with GEICO’s scores topping Progressive’s in seven of the 11 regions.
(Editor’s Note: Published 2023 scores for all carriers were much higher, averaging 822. A 2024 study redesign may account for the difference. The latest study measures customer satisfaction based on performance in seven core dimensions on a six-point (poor-to-perfect) rating scale—a different scale than used in prior studies. Dimensions scored are level of trust, price for coverage, people, ease of doing business, product/coverage offerings, problem resolution, and digital channels. In 2023, only five factors were assessed: billing process and policy information, claims, interaction, policy offering, and price, using a 10-point scale for assessments. See related article, “Why J.D. Power Auto Insurance Satisfaction Scores Are Lower in 2024.“)
While J.D. Power’s report does not indicate the degree to which lower GEICO prices may be contributing to its higher scores relative to Progressive in both years, at the Berkshire Hathaway annual meeting, Buffett highlighted GEICO’s “fundamental advantage” against all auto competitors—an underwriting expense ratio below 10 percent. It’s possible that the expense ratio advantage has continued to allow GEICO to be less aggressive on price and corrective underwriting actions, even as all carriers have reacted to loss cost inflation in recent years.
Related article: Trust Is Top Driver of Auto Insurance Customer Satisfaction: J.D. Power
“As long as customers have a high level of trust in their insurer, customer satisfaction and brand advocacy increase considerably, even in the face of rate increases,” the report found.
Still, only about half of the 41,000-plus auto insurance customers surveyed between August 2023 and April 2024 for the 2024 study said they trusted their insurers, with 51 percent falling in the low-trust category.
Who Do You Trust?
Whether lower prices or higher trust levels drive higher satisfaction and brand loyalty, as in past years, scores for mutual insurers—including the biggest one, State Farm—outpace customer satisfaction scores for stock companies writing U.S. auto insurance.
Below are average scores for the largest carriers included in the J.D. Power rankings (writing in 20 states or more). Large mutuals outscore stock companies by 45 points (or 32 points, excluding one extremely low result for stock company Kemper).
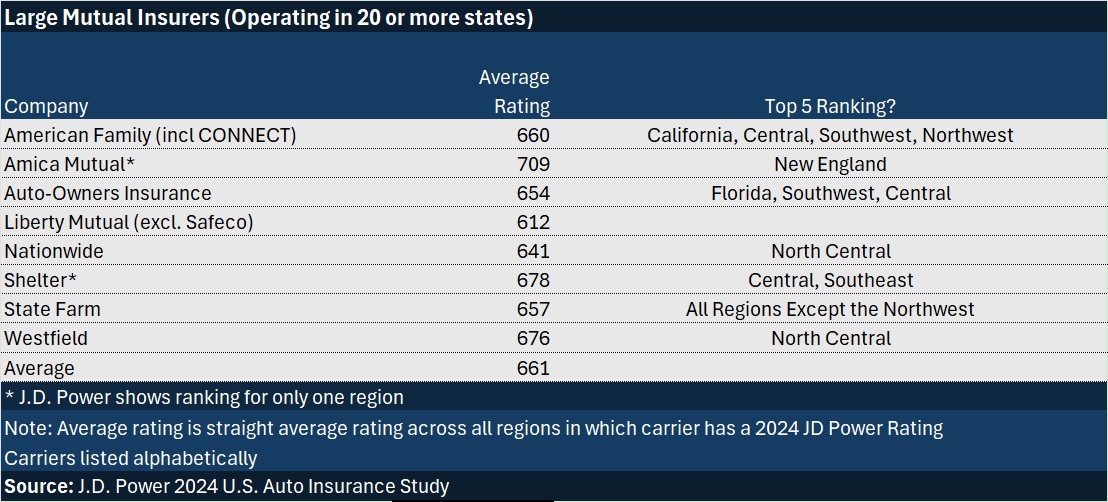
2024 J.D. Power U.S. auto insurance customer satisfaction scores for large mutual insurance companies ranged from 612 to 678.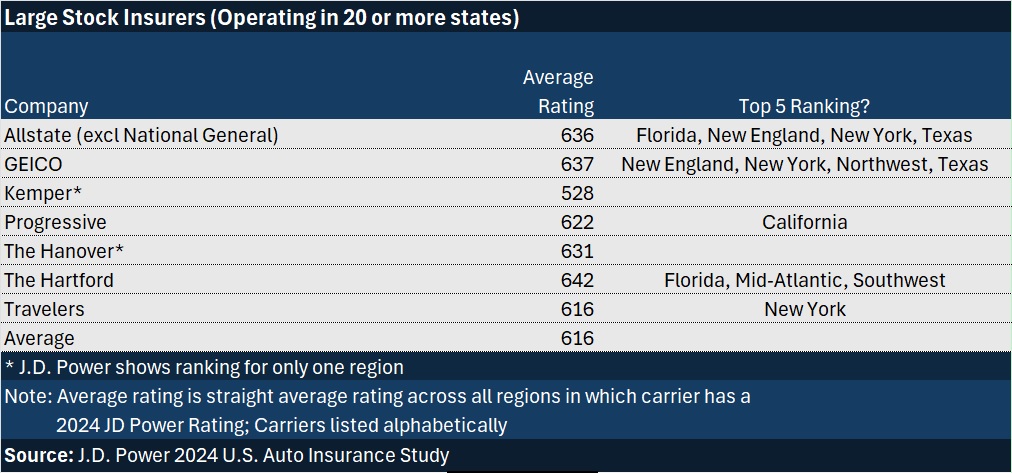
Satisfaction scores for large stock companies ranged from 528 to 642. Even the top score (for The Hartford) fell below all but two of the scores achieved by large mutuals. (Liberty Mutual and Nationwide were lower.)For smaller companies, too, mutual carriers garner better satisfaction scores than stock company peers, on average.
Comparing the Giants
The largest mutual carrier, State Farm, had a top-5 satisfaction score in 10 out of 11 regions studied by J.D. Power in 2024, and a top-3 score in seven of them.
In a head-to-head comparison with GEICO, State Farm is the clear winner in terms of satisfaction, besting GEICO in every region, with an average score some 20 points better than GEICO’s in the 2024 study. In the prior study, the race was closer, with GEICO’s average satisfaction score across all regions just 15 points lower than State Farm’s average.
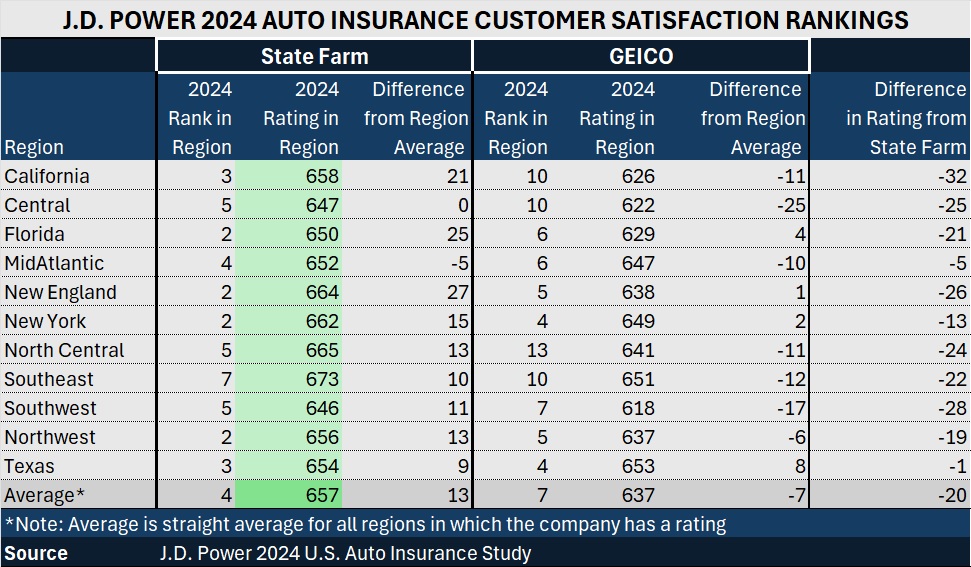
State Farm’s 2024 customer satisfaction scores eclipsed GEICO’s in every region.Financially, State Farm lagged other auto insurance giants, posting a 117.3 combined ratio for 2023 in spite of growing premiums more than 20%.
Allstate, which repeatedly reported rate hikes in 2023 during presentations to the investment community, still managed to record some of the highest customer satisfaction scores among large stock insurers, with its 636 —ranking third in the group behind The Hartford (with an average score of 642 in four regions) and GEICO (with an average of 637 across all 11 regions).
Offering a different measure of U.S. auto insurance customer behavior in April, in a shopping trends survey conducted in collaboration with TransUnion, J.D. Power reported that for carriers losing business in the first quarter of this year, customers were most likely to select Progressive as their new insurer when they went shopping for better prices.
Related article: Progressive Gains as Drivers Shop Around for Auto Insurance—Again
If Progressive loses a customer, it’s most likely to go to State Farm, that report showed.
Telematics: A Different Race. A Different Leader
When Berkshire’s Vice Chair Jain laments about GEICO’s competitive disadvantages relative to competitors like Progressive, he says that “GEICO had clearly missed the bus, and was late in terms of appreciating the value of telematics.”
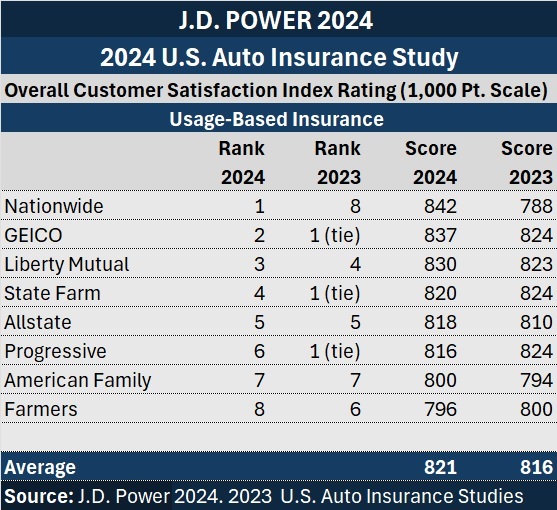
Yet, GEICO outpaced Progressive when J.D. Power asked the subset of auto insurance customers who participate in usage-based insurance programs about their satisfaction with the carriers this year.
In 2023, GEICO, Progressive and State Farm all tied for a first-place UBI satisfaction ranking. For the latest 2024 study, however, it was Nationwide that topped the list, beating GEICO by 5 points, and Progressive, State Farm and Allstate by 22 points or more.
In fact, Nationwide leapt from the worst UBI satisfaction rating in 2023 to the best in 2024.
Related article: Nationwide Insurance: Using a Decade of Learnings to Create Next-Generation Telematics Solutions
Unlike the overall customer satisfaction scores, which were measured differently in 2024 than they were in 2023, neither the components of the UBI satisfaction scores nor the calibration scale for calculating them have changed in 2024. According to Breanne Armstrong, director of global insurance intelligence at J.D. Power, UBI scores are based on these factors:
- Initial program setup/onboarding (for drivers that signed up for UBI within the past year)
- Ease of participating in the program
- Usefulness of the information received
- Functionality of the app/website
- Discounts received for participation
Overall satisfaction scores in 2024 are based on:
- Level of trust
- Price for coverage
- People
- Ease of doing business
- Product/coverage offerings
- Problem resolution
- Digital channels
In an email to Carrier Management, Armstrong noted that absent the change in the scale used for the overall scores (from a 10-point scale to a 6-point scale), the UBI satisfaction scores would fall slightly behind the overall satisfaction scores in 2024.
“When we segment auto insurance customers by whether they are currently participating in a UBI program or not, we see some big differences in how customers rate their overall experience with their auto insurer,” she added, noting that UBI participants are included in the full study in addition to evaluating their specific experience with UBI.
“Price for coverage, one of the [overall] study dimensions, is over 50 points higher for those currently participating in a UBI program vs. those who aren’t participating,” she wrote. “Interestingly, when we focus in on just the UBI portion of experience, the UBI attribute “discounts received for participation” is nearly flat year-over-year, while the attributes “ease of participating,” “functionality of the app/website” and “usefulness of the information received” are up slightly.
“So, despite the lack of improvement in the perception of the discounts UBI participants are getting, they are still rating the ‘price for coverage’ for their auto insurer significantly higher than those not enrolled in a UBI program,” she wrote. “It’s possible that they see additional value in UBI outside of just the benefit of getting a lower price on auto insurance.”
Armstrong also noted that the “digital channels” dimension of overall scores is higher for UBI participants, perhaps reflecting the fact that they are typically more engaged digitally. “Additional exposure to the digital experience with their carrier may be driving that, or it is possible that those who are more digitally savvy are more apt to sign up for UBI,” she wrote.
A key takeaway, she concluded, “is that UBI participation had the potential to improve the overall perception of the carrier and the customer experience.”
Armstrong noted that the calibration scale used for UBI satisfaction scores, like the overall satisfaction scores, will change from a 10-point to a 6-point scale next year in 2025.
During a recent J.D. Power webinar, “The Evolution of Auto Insurance Customer Satisfaction,” Armstrong also described some study enhancements on tap for 2025 with survey modules, including an expanded UBI section that will delve into changes in driving behavior for UBI customers and whether or not some customers get pricing penalties based on driving behavior, among other things.
Other areas that J.D. Power will look into in 2025 include customer reasons for bundling home and auto, and customer awareness and usage of value-add non-insurance services (coupons, memberships, mitigation services, etc.)
Was this article valuable?
Here are more articles you may enjoy.
 UBS Top Executives to Appear at Senate Hearing on Credit Suisse Nazi Accounts
  These Five Technologies Increase The Risk of Cyber Claims
  One out of 10 Cars Sold in Europe Is Now Made by a Chinese Brand
  Charges Dropped Against ‘Poster Boy’ Contractor Accused of Insurance Fraud
Want to stay up to date?
Get the latest insurance news
sent straight to your inbox.