A unique method to collect rain water samples during Hurricane Sandy has revealed the storm’s chemical “signature” with a new level of detail. The technique may also lead to weather model advances that will ultimately improve storm prediction, say researchers at the University of Utah.
Hurricane Sandy, also known as Superstorm Sandy, was the deadliest and most destructive hurricane of the 2012 Atlantic hurricane season, according to government sources. Damage estimates exceed $65 billion and nearly 300 people perished along the path of the storm in seven countries.
“As the climate changes in the 21st century, there is a possibility that more hurricanes will stray farther north along the eastern seaboard, like Sandy did,” says Stephen Good, a postdoctoral fellow in geology and geophysics at the University of Utah, and lead author on the study. “It therefore becomes increasingly important to better understand the processes at work in these large storm systems.”
To that end, researchers took to the Internet to invite volunteers to collect water samples as the storm passed.

“During Sandy, we used crowdsourcing to obtain an unprecedented collection of hurricane rain waters,” says Gabriel Bowen, associate professor of geology and geophysics, who launched the sampling effort after realizing the storm was on track to impact a large part of the eastern United States. “By taking advantage of data and samples gathered from residents on the ground, we were able to pinpoint where and when key features of the storm system developed and how they evolved, allowing us to develop a more complete picture of the storm.”
Tropical cyclones, also referred to as hurricanes when they occur over the North Atlantic Ocean, are rapidly rotating storm systems that cause strong winds and heavy rain. They form over large bodies of relatively warm water, deriving their energy from evaporation and eventual condensation of water from the ocean’s surface.
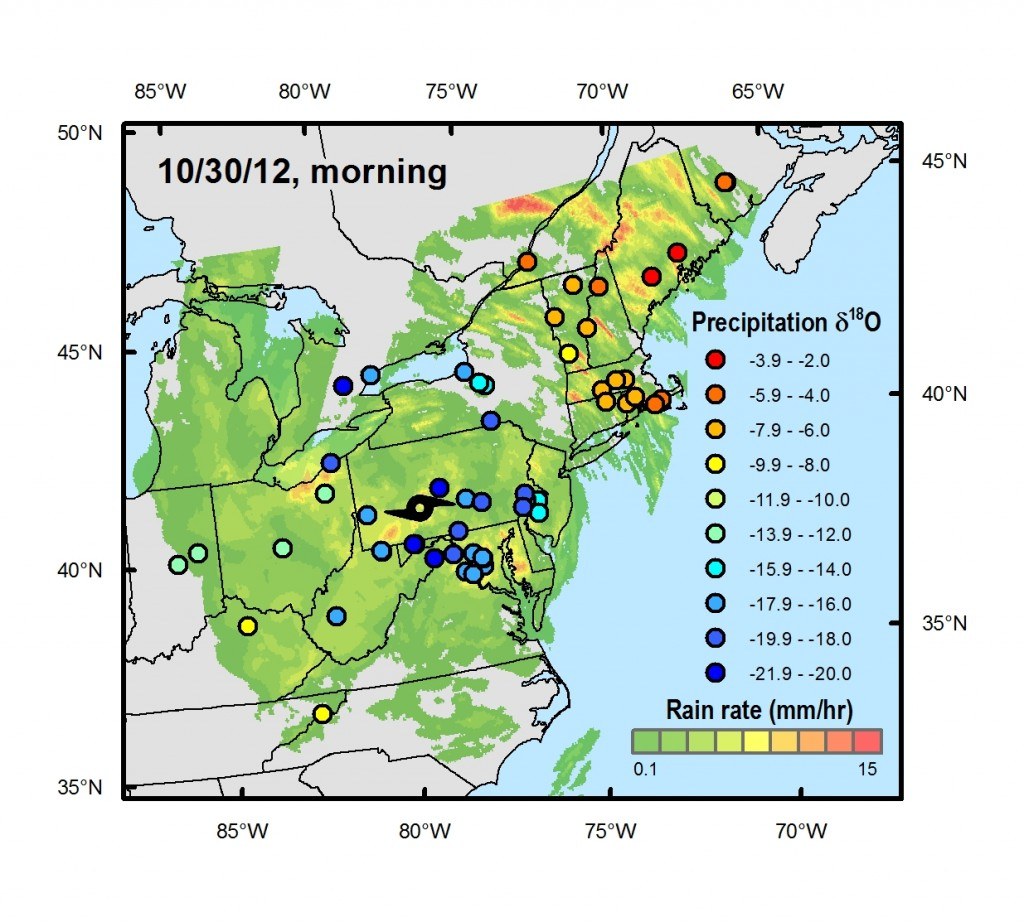
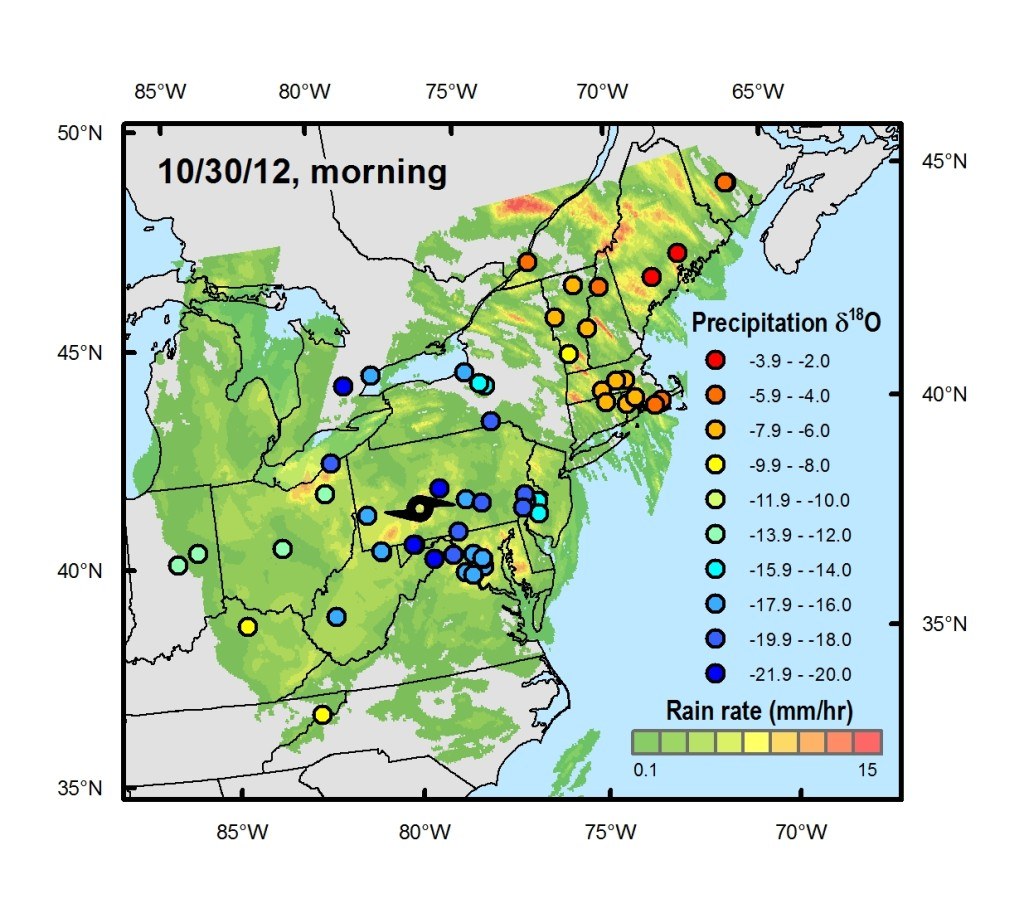
“Sandy left a distinctive isotopic signature in rain collected from the mid-Atlantic up into in New England that shows how a dry cold front originating out of the Midwest joined with Sandy – which developed from a tropical wave over warm water in the Caribbean – and likely prolonged and expanded the storm,” says Bowen.
The sampling technique provides a new way of studying how these “extra-tropical” hurricanes interact with the weather systems of the northern latitudes, and thereby aids in hurricane forecasting and analysis.
How to Catch the Rain
The team used a variety of electronic means – including science community email lists, Twitter, Facebook, blogs and crowdsourcing sites – to alert the public to the study and to solicit samples. A blog was established to provide instructions, background information and updates to participants: (http://wateriso.utah.edu/waterisotopes/pages/data_access/sandy.html)
For consistency, samples were collected on private property, from well-anchored containers in open, outdoor locations every 12 hours (8 a.m. and 8 p.m. Eastern time).
A total of 685 samples were collected from more than 125 volunteers at sites from North Carolina to Indiana to New Brunswick, Canada. The majority of the samples were obtained in regions of the U.S. mid-Atlantic – where the storm’s impact was greatest – but having samples from the further reaches of the storm was key in allowing the researchers to investigate processes occurring at Sandy’s margins.
The samples were shipped to the Utah lab in November 2012 and analyzed for their composition of hydrogen and oxygen isotopes, which provide a fingerprint of water sources, transport and rainout in the storm.
Inside the Storm
Isotopes are subtly different forms of chemical elements that vary in their weight and, as a result, their physical behavior. For example, heavier isotopes evaporate from liquids less readily and condense out of vapor more readily. As water changes state from liquid to vapor and vice versa, the variations in oxygen and hydrogen isotope ratios give researchers a sensitive tool to calculate the hydrologic budget – that is, the inflow, outflow and storage of water – of large cyclones.
For the analysis of the rain isotope data Bowen and Good teamed up with graduate student Derek Mallia and associate professor John Lin in the department of atmospheric sciences. Mallia and Lin made use of a computer model of the atmosphere which was able to “run the tape backwards” and track the source of the rainwater backwards to the locations that contributed moisture to the storm.
In this study, exceptionally low levels of the heavy isotope oxygen-18 were found in samples from the southwest area of the storm, tracking extreme losses of water as precipitation neared the storm’s center. Using their dense network of samples, the researchers were able to show this signature, which has also been used to reconstruct the occurrence of prehistoric hurricanes, was limited to a narrow region of the storm where the most intense precipitation was found.
As Sandy traveled north and its intensity decreased, the oxygen-18 levels moderated. However, levels of another isotope – deuterium – increased in parts of the storm when Sandy collided with the dry air from a continental cold front. The researchers argue that this signal shows that the storm picked up more moisture, and energy, from the frontal system and from evaporation off of the Atlantic, which led to intense rainfall over New England.
“The isotope data give fundamentally different information than can be obtained from satellite imagery or other conventional means of tracking storms,” says Good. “Satellite imagery gives you information about the location of clouds and rain, but it cannot tell you where this water, and the energy that it contributes to the storm, came from.”
Researchers anticipate that as these types of interactions are better documented and further studied, they may lead to advances in weather models that will ultimately improve storm prediction.
Source: University of Utah
Was this article valuable?
Here are more articles you may enjoy.


 One out of 10 Cars Sold in Europe Is Now Made by a Chinese Brand
  Credit Suisse Nazi Probe Reveals Fresh SS Ties, Senator Says
  Portugal Rolls Out $2.9 Billion Aid as Deadly Flooding Spreads
  These Five Technologies Increase The Risk of Cyber Claims